OPNids
Setup OPNids
Download the latest OPNids distribution from ( OPNids Download ).
Once you have OPNids up and running, you can start to configure the proper settings for Suricata, Dragonfly MLE, and Filebeats.
Setup Suricata
Using the navigation, select Suricata IDS > Administration.
- Check the
Enabledcheckbox. - Select the interface you would like suricata to be listening on. This should be the interface that is acting as your TAP.
- Select
Yesfor each event type you are interested in.
Below is a screenshot sample of the settings we have just applied, excluding interface selection. That may vary based on the host you have installed OPNids.
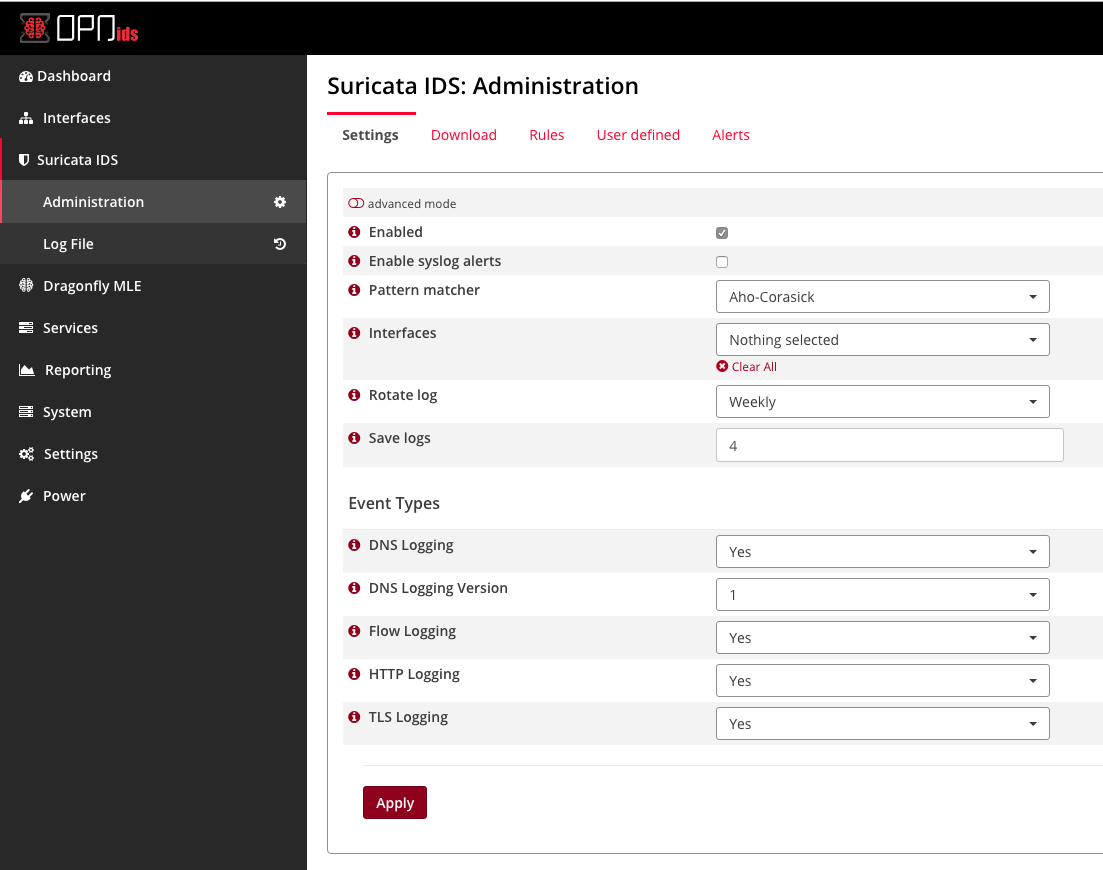
Suricata Settings
Once you have clicked Apply, Suricata will automatically start.
Setup Dragonfly MLE
Using the navigation, select Dragonfly MLE > Administration.
- Check the
Enabledcheckbox.
Once you have clicked Apply. Dragonfly MLE will automatically start.
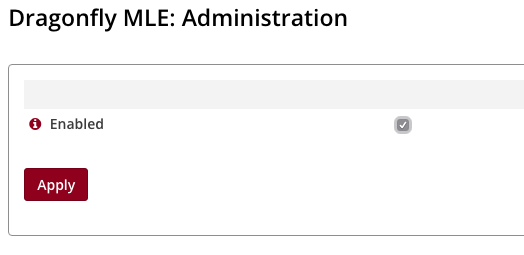
Dragonfly MLE Settings
Setup Filebeats
Using the navigation, select Services > Beats > Filebeat.
- Check the
Enabledcheckbox. - By default, suricata
eve.jsonpath is located at/var/log/suricata/eve.json. We want to switch this to use Dragonfly MLE logs. The default path for Dragonfly MLE logs is/var/log/dragonfly-mle/dragonfly-mle.log. - Enter the host(s) for your Logstash host.
- If you are using SSL encryption, enter the path to each file required
and check
Enabled SSL(OPTIONAL). Applysettings.
If everything was done right, you can now click Test Configuration
to test whether you have a valid filebeats configuration. You can also
click Test Connection to validate that you have a connection to your
Logstash host. If both validations are valid then there is nothing else
for you to do with the Filebeat settings. Check out the screenshot
below.
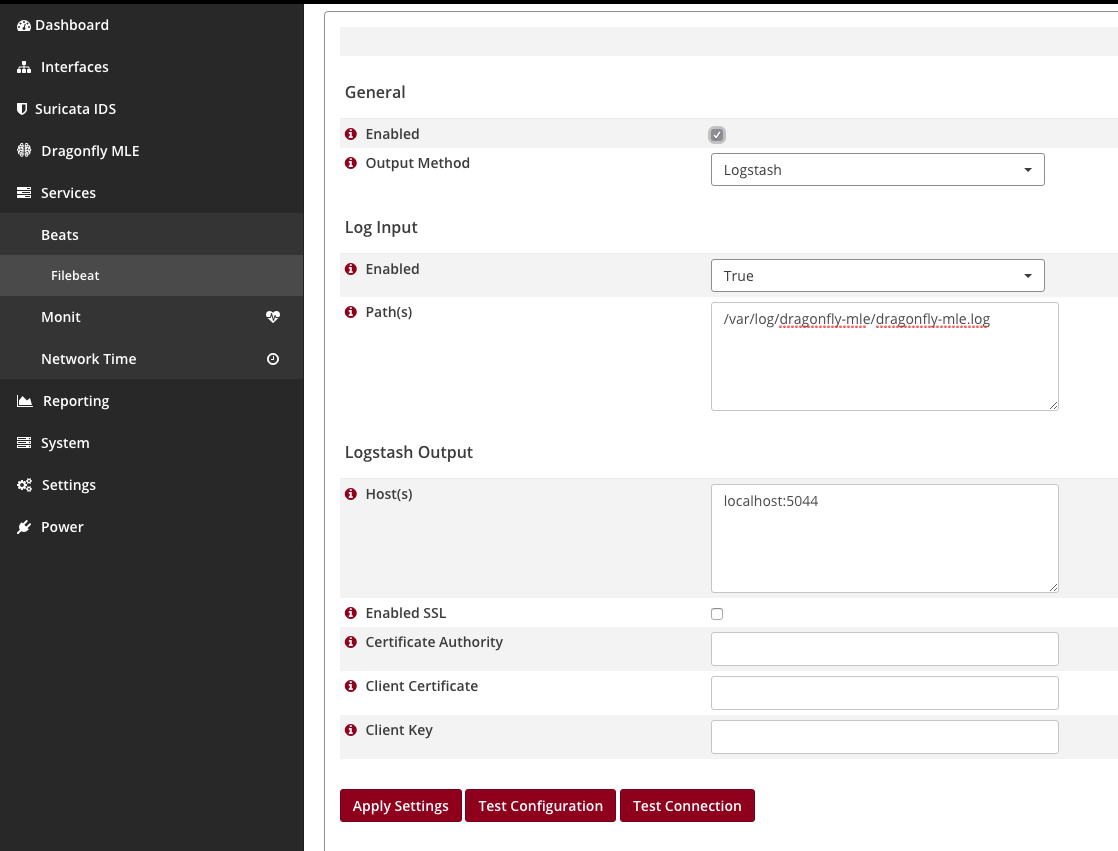
Filebeat Settings
Once your done, you can navigate to the Dashboard in OPNids and
click the green play button for Filebeats.
If everything is up and running, you should see all three services
running within the Services widget.
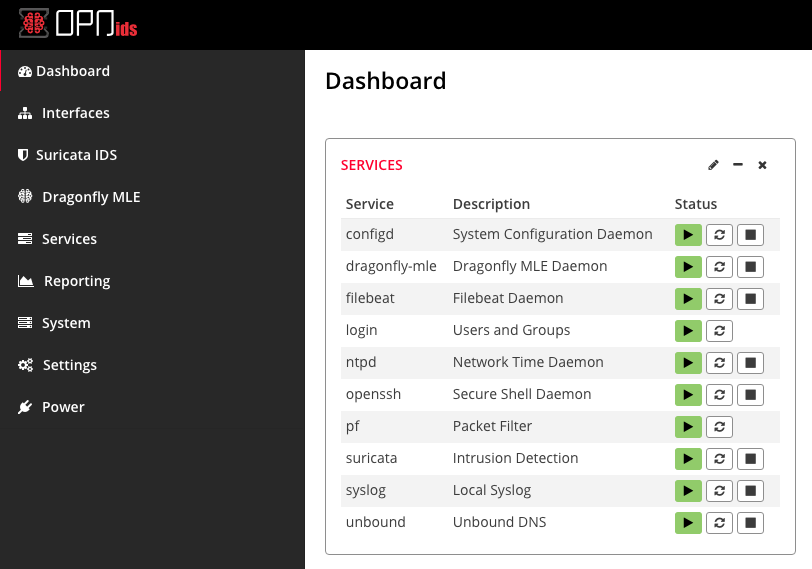
Services Widget
Setup Logstash
Your mileage may vary with Logstash, but for simplicity, below is a base
configuration for your logstash.conf. Where you see
elasticsearch:9200 in the .conf should be replace with your
Elasticsearch host. You can leave it as its default if your planning to
run the Elasticsearch and Logstash using docker-compose.
input {
    beats {
        port => 5044
    }
}
filter {
    json {
        source => "message"
        remove_field => ["message"]
    }
}
output {
    elasticsearch {
        hosts => ["elasticsearch:9200"]
        manage_template => false
        index => "logstash-%{+YYYY.MM.dd}"
    }
}
Setup Evebox
Please refer back to Evebox Documentation
If you have docker installed on the machine you are using and it’s a debian box. do the following.
# clone repo down
git clone https://github.com/counterflow-ai/evebox.git

# move into the directory
cd ./evebox

# this will build distribution pkgs without you having to install dependencies
./docker.sh release

# install debian package (may need sudo depending on user)
dpkg -i dist/evebox-latest-amd64.deb

# you now should be able to just run the below command. Change localhost to the IP of where your elasticsearch host is
evebox -v -e http://localhost:9200 -i logstash --elasticsearch-keyword keyword
Happy Threat Hunting!